9
Shareholder Value Creation in Japanese Pharmaceuticals
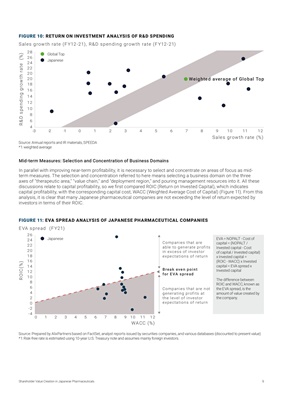
Mid-term Measures: Selection and Concentration of Business Domains
In parallel with improving near-term profitability, it is necessary to select and concentrate on areas of focus as midterm
measures. The selection and concentration referred to here means selecting a business domain on the three
axes of "therapeutic area," "value chain," and "deployment region," and pouring management resources into it. All these
discussions relate to capital profitability, so we first compared ROIC (Return on Invested Capital), which indicates
capital profitability, with the corresponding capital cost, WACC (Weighted Average Cost of Capital) (Figure 11). From this
analysis, it is clear that many Japanese pharmaceutical companies are not exceeding the level of return expected by
investors in terms of their ROIC.
Break even point
for EVA spread
WACC (%)
Source: Prepared by AlixPartners based on FactSet, analyst reports issued by securities companies, and various databases (discounted to present value)
*1: Risk-free rate is estimated using 10-year U.S. Treasury note and assumes mainly foreign investors.
ROIC(%)
-4
-2
0
2
4
6
8
10
12
14
16
18
20
22
24
26 0 1 2 3 4 5 6 7 8 9 10 11 12
Companies that are not
generating profits at
the level of investor
expectations of return
Companies that are
able to generate profits
in excess of investor
expectations of return
EVA = NOPALT - Cost of
capital = (NOPALT /
Invested capital - Cost
of capital / Invested capital)
x Invested capital =
(ROIC - WACC) x Invested
capital = EVA spread x
Invested capital
The difference between
ROIC and WACC, known as
the EVA spread, is the
amount of value created by
the company.
Japanese
EVA spread (FY21)
FIGURE 11: EVA SPREAD ANALYSIS OF JAPANESE PHARMACEUTICAL COMPANIES Sales growth rate (%)
Source: Annual reports and IR materials, SPEEDA
*1: weighted average
3
-3 4
-2 -1 10 9
2 5 6 7 8
16
10 12
11
4
6
20
18
20
22
24
26
28
8
10
12
14
R&D spending growth rate (%)
Weighted average of Global Top
Global Top
Japanese
Sales growth rate (FY12-21), R&D spending growth rate (FY12-21)
FIGURE 10: RETURN ON INVESTMENT ANALYSIS OF R&D SPENDING