5
Shareholder Value Creation in Japanese Pharmaceuticals
3. DIRECTION FOR IMPROVING THE ENTERPRISE VALUE OF JAPANESE
PHARMACEUTICAL COMPANIES
The Increasing Importance of Cash Generation
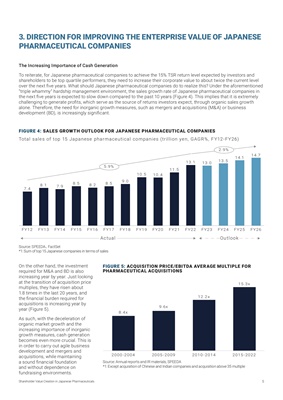
To reiterate, for Japanese pharmaceutical companies to achieve the 15% TSR return level expected by investors and
shareholders to be top quartile performers, they need to increase their corporate value to about twice the current level
over the next five years. What should Japanese pharmaceutical companies do to realize this? Under the aforementioned
"triple whammy" hardship management environment, the sales growth rate of Japanese pharmaceutical companies in
the next five years is expected to slow down compared to the past 10 years (Figure 4). This implies that it is extremely
challenging to generate profits, which serve as the source of returns investors expect, through organic sales growth
alone. Therefore, the need for inorganic growth measures, such as mergers and acquisitions (M&A) or business
development (BD), is increasingly significant.
On the other hand, the investment
required for M&A and BD is also
increasing year by year. Just looking
at the transition of acquisition price
multiples, they have risen about
1.8 times in the last 20 years, and
the financial burden required for
acquisitions is increasing year by
year (Figure 5).
As such, with the deceleration of
organic market growth and the
increasing importance of inorganic
growth measures, cash generation
becomes even more crucial. This is
in order to carry out agile business
development and mergers and
acquisitions, while maintaining
a sound financial foundation
and without dependence on
fundraising environments.
Total sales of top 15 Japanese pharmaceutical companies (trillion yen, GAGR%, FY12-FY26)
FIGURE 4: SALES GROWTH OUTLOOK FOR JAPANESE PHARMACEUTICAL COMPANIES
Source: SPEEDA、FactSet
*1: Sum of top 15 Japanese companies in terms of sales
13.1 13.0
13.5
14.1
14.7
FY13
FY12 FY19
FY14 FY18
8.5
7.4
FY15 FY16 FY24
FY17 FY20 FY21 FY22 FY23 FY25 FY26
8.1 7.9 8.2 8.5
11.5
9.0
10.5 10.4
Actual Outlook
5.9%
2.9%
Source: Annual reports and IR materials, SPEEDA
*1: Except acquisition of Chinese and Indian companies and acquisition above 35 multiple
2010-2014
2000-2004 2005-2009 2015-2022
8.4x
9.6x
12.2x
15.3x
FIGURE 5: ACQUISITION PRICE/EBITDA AVERAGE MULTIPLE FOR
PHARMACEUTICAL ACQUISITIONS