11
Shareholder Value Creation in Japanese Pharmaceuticals
Selection and focus along the
"Therapeutic Area" axis
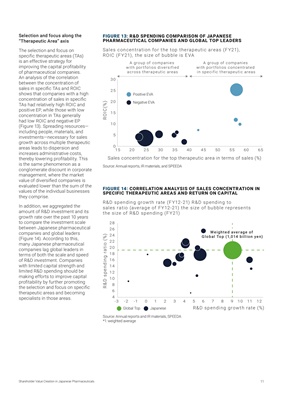
The selection and focus on
specific therapeutic areas (TAs)
is an effective strategy for
improving the capital profitability
of pharmaceutical companies.
An analysis of the correlation
between the concentration of
sales in specific TAs and ROIC
shows that companies with a high
concentration of sales in specific
TAs had relatively high ROIC and
positive EP, while those with low
concentration in TAs generally
had low ROIC and negative EP
(Figure 13). Spreading resources-
including people, materials, and
investments-necessary for sales
growth across multiple therapeutic
areas leads to dispersion and
increases administrative costs,
thereby lowering profitability. This
is the same phenomenon as a
conglomerate discount in corporate
management, where the market
value of diversified companies is
evaluated lower than the sum of the
values of the individual businesses
they comprise.
In addition, we aggregated the
amount of R&D investment and its
growth rate over the past 10 years
to compare the investment scale
between Japanese pharmaceutical
companies and global leaders
(Figure 14). According to this,
many Japanese pharmaceutical
companies lag global leaders in
terms of both the scale and speed
of R&D investment. Companies
with limited capital strength and
limited R&D spending should be
making efforts to improve capital
profitability by further promoting
the selection and focus on specific
therapeutic areas and becoming
specialists in those areas.
R&D spending ratio (%)
4
-1 2
-3
28
5
10 8
3 76
10
9 10
18
20
22
24
26
8
11 12
4
6
12
14
16
-2
R&D spending growth rate (%)
Weighted average of
Global Top (1,014 billion yen)
Global Top Japanese
R&D spending growth rate (FY12-21) R&D spending to
sales ratio (average of FY12-21) the size of bubble represents
the size of R&D spending (FY21)
FIGURE 14: CORRELATION ANALYSIS OF SALES CONCENTRATION IN
SPECIFIC THERAPEUTIC AREAS AND RETURN ON CAPITAL
Source: Annual reports and IR materials, SPEEDA
*1: weighted average
A group of companies
with portfolios diversified
across therapeutic areas
A group of companies
with portfolios concentrated
in specific therapeutic areas
Sales concentration for the top therapeutic area in terms of sales (%)
ROIC(%)
0
5
10
15
20
25
30
15 20 25 30 35 40 45 50 55 60 65
Positive EVA
Negative EVA
Sales concentration for the top therapeutic areas (FY21),
ROIC (FY21), the size of bubble is EVA
FIGURE 13: R&D SPENDING COMPARISON OF JAPANESE
PHARMACEUTICAL COMPANIES AND GLOBAL TOP LEADERS
Source: Annual reports, IR materials, and SPEEDA