10
Shareholder Value Creation in Japanese Pharmaceuticals
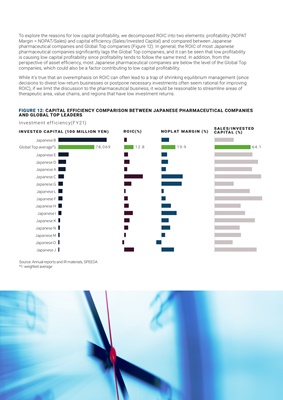
To explore the reasons for low capital profitability, we decomposed ROIC into two elements: profitability (NOPAT
Margin = NOPAT/Sales) and capital efficiency (Sales/Invested Capital) and compared between Japanese
pharmaceutical companies and Global Top companies (Figure 12). In general, the ROIC of most Japanese
pharmaceutical companies significantly lags the Global Top companies, and it can be seen that low profitability
is causing low capital profitability since profitability tends to follow the same trend. In addition, from the
perspective of asset efficiency, most Japanese pharmaceutical companies are below the level of the Global Top
companies, which could also be a factor contributing to low capital profitability.
While it's true that an overemphasis on ROIC can often lead to a trap of shrinking equilibrium management (since
decisions to divest low-return businesses or postpone necessary investments often seem rational for improving
ROIC), if we limit the discussion to the pharmaceutical business, it would be reasonable to streamline areas of
therapeutic area, value chains, and regions that have low investment returns.
SALES/INVESTED
CAPITAL (%)
NOPLAT MARGIN (%)
ROIC(%)
Source: Annual reports and IR materials, SPEEDA
*1: weighted average
64.1
19.9
12.8
Japanese B
78,069
Investment efficiency(FY21)
FIGURE 12: CAPITAL EFFICIENCY COMPARISON BETWEEN JAPANESE PHARMACEUTICAL COMPANIES
AND GLOBAL TOP LEADERS
INVESTED CAPITAL (100 MILLION YEN)
Japanese E
Japanese L
Japanese G
Japanese C
Japanese A
Japanese D
Japanese N
Japanese K
Japanese I
Japanese H
Japanese F
Japanese O
Japanese M
Japanese J
Global Top average*�