Hospitality loses one in 18 sites after rocky year
1. Market overview
Introduction by Karl Chessell, CGA by NIQ director - hospitality operators and food, EMEA
After a tough first half of 2023 for businesses and consumers alike,
our latest Hospitality Market Monitor sets out the mixed impacts
on Britain's licensed sector. It shows a 1.1% contraction in site
numbers over the last quarter to a little over 100,000 sites, and if
current trends continue the total will drop from six figures into five
for the first time since the Monitor began.
The 1,139 net closures and associated job losses between March
and June have been distressing for all those involved. Soaring
costs in energy, food, labour and more inputs have worn away
businesses' profit margins, and high inflation and interest rate
rises have weakened consumer confidence.
Despite this, some key indicators remain positive. The Coffer
CGA Business Tracker has recorded year-on-year growth in sales
at managed pubs, bars and restaurants in every month of 2023
so far, while the CGA and Fourth Business Confidence Survey
indicates leaders' optimism has increased since the start of the
This edition of the Hospitality Market Monitor shows Britain had
100,176 licensed premises at the end of June 2023. It represents
a net decline of 1,139 sites over the second quarter of 2023, and
of 5,736 sites over the last 12 months. Put another way, Britain has
lost around one in 18 of its licensed premises since June 2022.
This extends a long-term downward trend that was dramatically
accelerated by COVID-19. Since the pandemic hit in early 2020,
Britain has seen a net decline of 14,932 sites-13.0% of the
pre-COVID total. Smaller businesses have borne the brunt, and
76.5% of all these net closures have been in the independent
sector. By contrast, the managed segment has only 3.7%
fewer sites than it did pre-COVID.
However, it's not all doom and gloom. Total net closures in the
first half of 2023 (1,895) were less than half the number seen in
the second half of 2022 (3,841), and many units that have been
vacated recently have been swiftly reoccupied by other
operators-often emerging multi-site groups. Of course, it
remains to be seen whether this slowdown continues or whether
relentlessly high costs force more closures over the remainder
of 2023.
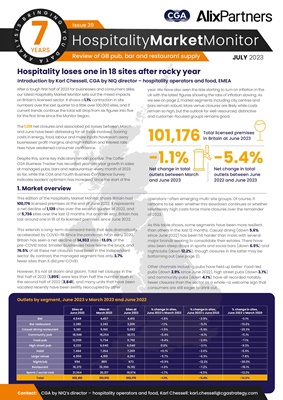
As this table shows, some segments have been more resilient
than others in the last 12 months. Casual dining (down 5.6%
since June 2022) has been hit harder than most, with several
major brands seeking to consolidate their estates. There have
also been steep drops in sports and social bars (down 6.5%) and
nightclubs (down 12.2%), though closures in the latter may be
bottoming out (see page 2).
Other channels including pubs have held up better. Food-led
pubs (down 2.9% since June 2022), high street pubs (down 3.1%)
and community pubs (down 4.1%) have all recorded notably
fewer closures than the sector as a whole-a welcome sign that
consumers are still eager to drink out.
year. We have also seen the tide starting to turn on inflation in the
UK with the latest figures showing the rate of inflation slowing. As
we see on page 2, market segments including city centres and
bars remain robust. More venue closures are likely while costs
remain so high, but the outlook for well-resourced, distinctive
and customer-focused groups remains good.
HospitalityMarketMonitor
JULY 2023
Issue 39
Review of GB pub, bar and restaurant supply
77YEARS
B R I N G I N G Y O U D A T A A N A L Y S I S
Sites at
June 2022
Sites at
March 2023
Sites at
June 2023
% change in sites,
June 2023 v March 2023
% change in sites,
June 2023 v June 2022
% change in sites,
June 2023 v March 2020
Bar 4,544 4,457 4,413 -1.0% -2.9% -3.1%
Bar restaurant 3,380 3,242 3,206 -1.1% -5.1% -13.0%
Casual dining restaurant 5,381 5,160 5,082 -1.5% -5.6% -23.3%
Community pub 18,948 18,254 18,172 -0.4% -4.1% -11.1%
Food pub 12,055 11,754 11,702 -0.4% -2.9% -7.1%
High street pub 6,232 6,040 6,040 0.0% -3.1% -9.3%
Hotel 7,464 7,264 7,269 +0.1% -2.6% -6.5%
Large venue 4,550 4,519 4,263 -5.7% -6.3% -7.8%
Nightclub 994 865 873 +0.9% -12.2% -30.0%
Restaurant 16,372 15,350 15,192 -1.0% -7.2% -19.1%
Sports / social club 21,364 20,317 19,974 -1.7% -6.5% -12.3%
Total 105,912 101,315 100,176 -1.1% -5.4% -13.0%
Outlets by segment, June 2023 v March 2023 and June 2022
101,176
-1.1% -5.4%
Total licensed premises
in Britain at June 2023
Net change in total
outlets between March
and June 2023
Net change in total
outlets between June
2022 and June 2023
Contact: CGA by NIQ's director - hospitality operators and food, Karl Chessell: karl.chessell@cgastrategy.com