The rise of the experiential consumer, and why DE&I is the future of the U.S. restaurant industry 8
HOW BEING FRONT-FOOTED ON DE&I
ACTIVATION COULD UNLOCK POTENTIAL
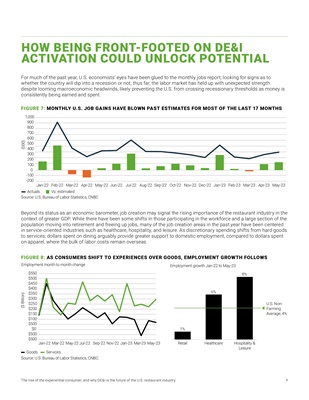
For much of the past year, U.S. economists' eyes have been glued to the monthly jobs report, looking for signs as to
whether the country will dip into a recession or not; thus far, the labor market has held up with unexpected strength
despite looming macroeconomic headwinds, likely preventing the U.S. from crossing recessionary thresholds as money is
consistently being earned and spent.
FIGURE 7: MONTHLY U.S. JOB GAINS HAVE BLOWN PAST ESTIMATES FOR MOST OF THE LAST 17 MONTHS
700
600
200
800
1,000
-200
900
-100
0
100
300
400
500 Jan-22 Feb-22 May-22 Jun-22 Aug-22 Sep-22 Oct-22 Nov-22 Dec-22 Jan-23 Feb-23 Mar-23 Apr-23 May-23
Jul-22
Apr-22
Mar-22
(000)
Vs. estimated
Actuals
Source: U.S. Bureau of Labor Statistics, CNBC
Beyond its status as an economic barometer, job creation may signal the rising importance of the restaurant industry in the
context of greater GDP. While there have been some shifts in those participating in the workforce and a large section of the
population moving into retirement and freeing up jobs, many of the job creation areas in the past year have been centered
in service-oriented industries such as healthcare, hospitality, and leisure. As discretionary spending shifts from hard goods
to services, dollars spent on dining arguably provide greater support to domestic employment, compared to dollars spent
on apparel, where the bulk of labor costs remain overseas.
FIGURE 8: AS CONSUMERS SHIFT TO EXPERIENCES OVER GOODS, EMPLOYMENT GROWTH FOLLOWS
Retail Healthcare
1%
6%
8%
U.S. NonFarming
Average; 4%
Hospitality &
Leisure
$0
$300
$100
$150
$400
$200
Mar-23
$500
$450
$350
$250
$500
$500
$500
May-23
Mar-22 May-22 Jul-22 Sep-22
Jan-22 Jan-23
Nov-22
$550
($ Billion)
Employment growth Jan-22 to May-23
Employment month to month change
Source: U.S. Bureau of Labor Statistics, CNBC
Goods Services